
The paper shows how the open-source tool, PasTmon, can perform in-depth application performance monitoring simply by sniffing packets between the client and server systems.
(This paper was originally published in SysAdmin magazine June 2007)
Introduction
We recently had a problem with a web server which was running very slow at intermittent times throughout the day. As is the usual case, the server sysadmins said the network was slow, and the network admins said the server was slow. We were sure that the problem was in the server, but all of the performance statistics – CPU, memory, & disk were not showing any problems. We needed a tool which would monitor the application performance and response times from the network side, and be able to collect statistics over quite large periods of time. A solution was found : PasTmon, the Passive Application Response Time Monitor.
PasTmon simply listens on a network interface in much the same way as tools such as Tcpdump, Ethereal, and Snort. But it is different in that what it does is measure the time between received ethernet frames in application streams and uses these timings to analyse the performance of the applications sending and receiving the frames.
PasTmon collects all of the timings for you to see exactly how your application is performing when it is receiving and replying to network request packets. Web servers, database servers, mail servers, and DNS servers are all common candidates for performance analysis and PasTmon will show you exactly how well they are performing.
PasTmon is amazingly flexible, it uses a plugin model which allows you to select custom filters for network protocols to be analysed.
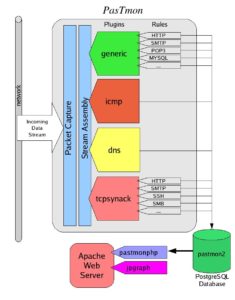
Figure 1: PasTmon’s structure
Figure 1 shows the basic structure of PasTmon. The network traffic is received by the packet capture interface (using libpcap). The streams are then reassembled and presented to the plugins. The plugins have rules which analyse the stream and match the data against signatures. Traffic flows which match signatures then have their timings analysed and recorded into the database at regular intervals. In addition, PasTmon provides a PHP program which connects to the database and presents graphical reports to a web browser through an Apache web server.
Installation
Installation of PasTmon itself is straightforward. However, it requires a number of prerequisite packages which may be harder to install. The packages required are:
- glib2 – GTK core library
- libpcap – packet capture library
- PostgreSQL – database
- libdbi – database interface
- DBI,DBD::Pg – PostgreSQL db interface
- Apache (or similar) – web server for accessing reports
- PHP4/5 – hypertext preprocessor language
- jpgraph – graphing library for php
- pcre – perl-compatible regular expression library
Other database types are supported through the libdbi abstraction library (for example, mysql) but PostgreSQL is recommended. If you are building PasTmon from the source package, you will also need:
- gcc – the GNU C compiler
- bison – the grammar parser generator
- flex – the lexical analyser generator
- pkgconfig – package system that manages flags for libraries
The PasTmon Install Guide includes good instructions on where to get the packages from – in most cases precompiled packages are available. On my Fedora system I used ‘yum’ to load most of the packages, but had problems with libdbi – I resolved this by downloading the source package for libdbi version 0.7.2 (which also requires a package for database drivers) and building it with PostgreSQL explicitly defined.
Once the prerequisite packages are ready, either install the precompiled package for PasTmon, or install from the source in the normal way:
|
1 2 3 4 5 |
$ tar zxvf pastmon-<version-release>.tar.gz $ cd pastmon-<version-release> $ ./configure $ make $ sudo make install |
By default, it will install into /usr/local/pastmon
Now, wheck that the DBI interface is working by running PasTmon’s test program:
|
1 |
# /usr/local/pastmon/bin/list_libdbi_drivers |
it should list out the DBI drivers that it has access to, for PostgreSQL it should simply list “pgsql”.
Now create a group and user account for pastmon to run under:
|
1 2 |
# groupadd pastmon # useradd -d /usr/local/pastmon -g pastmon pastmon |
I found that the database creation script needed to be changed to add grants for the user that pastmon is running under, by default it add grants for root. Edit /usr/local/pastmon/bin/postgresql_admin/create_database_summary and change the occurrences of “root” to “pastmon”. For example,
change:
|
1 |
CREATE USER root WITH NOCREATEDB NOCREATEUSER; |
to:
|
1 |
CREATE USER pastmon WITH NOCREATEDB NOCREATEUSER; |
.. and so on.
Now start PostgreSQL and create the database:
# /etc/init.d/postgresql start
# /usr/local/pastmon/bin/postgresql_admin/create_database_summary
Now set up the pastmonphp reporting tool in you web server root directory, eg. /var/www/html
|
1 2 |
# cd /var/www/html # ln -s /usr/local/pastmon/share/pastmonphp pastmonphp |
and also jpgraph:
|
1 |
# ln -s /usr/share/jpgraph jpgraph |
Configuration
Configuration is very simple, and the default configuration probably will not need changing. All of the configuration files are under /usr/local/pastmon/etc, the main one being pastmon.config.
Make sure that the pastmon process does not run as root, use the pastmon userid instead:
|
1 2 |
user = "pastmon"; group = "pastmon"; |
and configure the userid for access to the PostgreSQL database:
|
1 2 3 4 |
driver = "pgsql"; // host = "localhost"; username = "pastmon"; password = "pastmon"; |
The default plugin has rules to capture HTTP traffic, but in the case of the problem I needed to solve I had to drill down a bit further. I wanted to capture the response time statistics for the webmail aplication which was running on the web server being analysed. To do this, I added a signature to the pastmon-http-sigs.inc configuration file in the /usr/local/pastmon/etc configuration directory:
|
1 2 3 4 5 6 |
// http "GET " request for webmail transaction GET_webmail { Offset = 0; Depth = 50; Content =~ "GET .*/webmail/"; } |
This block should be added just before the rule for the normal HTTP “GET” command. This causes pastmon to collect individual statistics for HTTP requests going to the regular expression matched by “GET .*/webmail/” which is all webmail requests.
You can specify quite complex rules for PasTmon to collect as signatures. For example, say you wanted to collect separate statistics for each URL that the web server receives. The following rule will allow you to do this:
|
1 2 3 4 5 6 |
// http "GET " request for all URLs transaction GET_$1 { Offset = 0; Depth = 50; Content =~ "GET (\S*)"; } |
This works just like perl regular expressions, where $1 represents the contents between the parenthesis “(\S*)”. This rule will create a separate signature and set of statistics for every different URL sent to the web server in a GET request – which on some web sites could create a large number of signatures in the database. Note in this case that the URL string is restricted in length to 50 characters by the Depth option.
Running
It is important to connect the PasTmon monitoring system on a network connection where it will be able to capture the traffic to and from the server being monitored. This means that the traffic to and from the server will also need to be sent to the PasTmon monitoring system. You could use a plain old ethernet hub for this – although these are becoming hard to find nowadays and are usually of a low speed type ( typically 10Mbps ). A number of switches can perform the function of copying data to a montoring port – known as a SPAN port on Cisco swicthes, or a “mirroring” port on some other types of switch. I’ve found that some low-cost switches, such as the DLink DGS-1216T, can perform this function so in most cases you need not buy an expensive Cisco switch to do this.
The PasTmon packet capture system should be placed as close as practical to the servers being monitored in order to collect statistics which are as accurate as possible. The distributed design of PasTmon also means that you don’t need to install everything on one system. You might have the pastmon sensor process on one server, the PostgreSQL database on another, and the Apache web server and pastmonphp program on another server again. This permits a distributed model of sensors, database, and reporting interfaces which should fit in with organisations that tend to insert firewalls throughout their infrastructure.
Before running pastmon for monitoring, test that it is working properly, and can see network traffic by running it in raw mode as a foreground process:
|
1 2 |
# cd /usr/local/pastmon/bin # ./pastmon -i eth0 -u pastmon -g pastmon -o - -r 0 -D -O |
Where eth0 is the name of the network interface to listen on.
Let it run a few minutes, or however long it needs to collect some traffic, then kill it with CTRL-C. It should dump some statistics on the data it collected, such as packet counts, byte counts, signatures matched, and so on.
When you’re ready to run PasTmon for real, its best to use one of the prepackaged scripts to start it up in a mode where it will start recording into the database:
|
1 |
# ./pastmon_startpastmonsql eth0 |
this will start the pastmon process, showing a few lines of messages as it does so, then the process will put itself into the background for monitoring. If it has problems connecting to the database (you did remember to start PostgreSQL, didn’t you?) then it will log messages saying so and after retrying for a number of times will stop running.
There are some RC startup scripts in /usr/local/pastmon/etc adapted to RedHat/Fedora, Solaris and Gentoo for starting PasTmon when the system boots.
By default, PasTmon collects statistics on traffic over an interval of 5 minutes and then writes summary records into the database for the minimum, maximum, and average readings over the 5 minutes. Over longer periods of time you probably are less interested in 5-minute statistics so pastmon includes a script called pastmon_summarise_level2.pl which you can run which will summarise the 5-minute level 1 statistics into level 2 statistics which cover longer periods of time.
Reports
The amount of timing information that PasTmon generates is, to put it simply, amazing. The PHP report generator can be accessed by pointing your browser to the Apache web server:
|
1 |
http://server.domain/pastmonphp |
The pastmonphp user interface is easy and intuitive to use. From the main page you will probably want to go into the “Level 1” statistics page where you can view a summary of the traffic data collected.
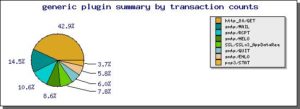
Figure 2
Figure 2 shows a summary of the signatures collected by the generic plugin. The other plugins that are enabled will also show up as summaries.
From the Level 1 page you can then select the signature that you want to look at in further detail (GET_webmail in this example case), and then select the server and clients for the traffic you’re interested in.
The next page presents the statistics collected by the generic plugin that you can generate into a graph. The options are:
- transaction count
- time to first response from server
- time to last response sent from server
- network round trip time
- time to last ACK received from client
- estimated time to delivery of last packet to client
- packets acknowledged from client
- bytes acknowledged by client
- size of packets from server
- count of packets from server
- client max segment size
- server max segment size
- client and server window sizes
you can select the minimum, maximum or average of these values (taken over the 5-minute sampling time). After clicking on the statistic you want to look at you can then select the time frame that you’re interested in and plot the graph.
Below is two graphs from the GET_webmail signature I configured to capture HTTP traffic to the webmail application.
Here I’ve plotted the average time from the start of the request to the last response frame sent from the server (last_avg statistic). This gives us a good measure of how long it takes the server to generate the HTML page and send it to the client.
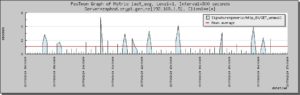
Figure 3
In figure 3 you can see from the high spikes that the webmail web application can be very slow, although in this graph the scaling due to a number of very high peaks can obscure the underlying problem. Fortunately, PasTmon also generates histograms which shows very clearly just how well the application is performing:
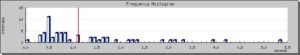
Figure 4
Figure 4 shows a histogram of access timings to the webmail application. From this you can see that most page delivery times from the webmail HTTP server are below 1 second, however there are quite a few pages taking more than a second, and some take as long as 5 seconds – which is unacceptably slow. Bear in mind that this is the average response time for webmail pages over a sample time of five minutes, so some of those requests must have been very slow. Further and more precise analysis can be made by updating the signature pattern to identify exactly which functions within the webmail application are being slow.
I extended the webmail rule to collect statistics based on the individual functions in the webmail application (SquirrelMail in this case):
|
1 2 3 4 5 6 |
// http "GET " request - webmail functions transaction GET_webmail_$1 { Offset = 0; Depth = 50; Content =~ "GET .*/webmail/src/([a-z\-_\.]+)"; } |
This generates signatures such as GET_webmail_left_main.php, GET_webmail_read_body.php, and GET_webmail_right_main.php with response times recorded for each. Working through the graphs for each of these, some were showing slow response times, especially right_main.php – the function which generates the list of Emails within a mailbox.
Further examination showed that right_main.php was making lots of calls to the IMAP mail server – and directing PasTmon to examine the IMAP traffic showed that the IMAP server was indeed responsible for much of the webmail performance delays. After upgrading the IMAP server to have a faster CPU we found that webmail performance was greatly improved : all pages were delivered to the client within one second.
It pays to have a good understanding of how the TCP handshake and data transfer is performed and which timings are relevent to finding problems. Of course, not all applications are based on HTTP, but PasTmon have enough flexibility to capture response statistics for almost any application which is used over the network.
As well as generating nice graphs, PasTmon stores all of the collected data in a PostgreSQL database so you can write your own SQL scripts to extract the data and report on it or analyse it in any number of other ways.
Conclusions
Performance problems can often be very hard to diagnose and solve. This is mainly due to the insidious nature of performance problems – time and again I’ve experienced genuine sysadmins who don’t believe their systems have a problem simply because the sar logs don’t show high CPU or memory usage. Many times I’ve seen performance problems that people have almost given up trying to resolve due to the complex nature of networked multi-tier applications. Analysing the performance of applications by the timings of network traffic is one of the best ways to identify these problems quickly, and PasTmon is an excellent tool in this case.
PasTmon is very good at capturing application performance information not only to find problems but also as an excellent tool to capture and compare data before and after an upgrade takes place. The amount of timing data that is collected and can be presented is certainly quite remarkable, and the database storage makes it easy to extract and analyse the data.
Whatever systems you may be responsible for, or may be working on, bear in mind that they are all measured by their performance. In many cases I’ve worked on, poor performance of IT systems has affected the ability of some companies to operate efficiently and in the case of online web servers and applications companies frequently lose customers due to bad systems performance.
References
PasTmon site
http://pastmon.sourceforge.net/